You can use a variety of graphics software to draw ELISA standard curve.
Take "Curve Expert1.4" software as example.
1. Start "Curve Expert"
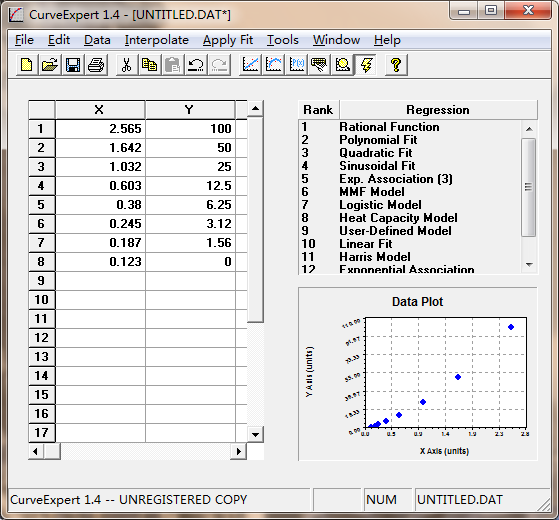
2. Input OD values of the standard on X-axis, and input the corresponding concentration on Y-axis, which is illustrated as below:
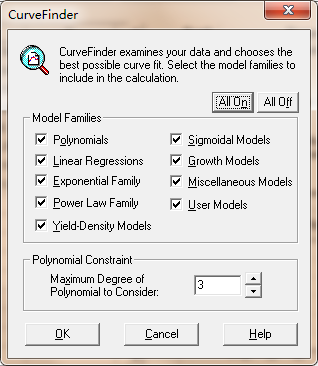
3. Click [ Run ]

button , the following dialog box appears:
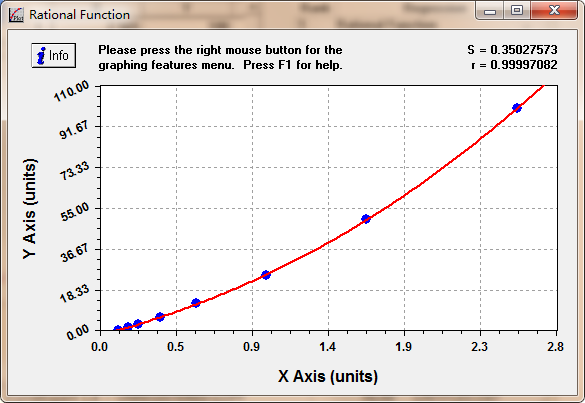
4. Click [ ok ] button, the following two dialog boxes appear. Close the 2nd dialog box.
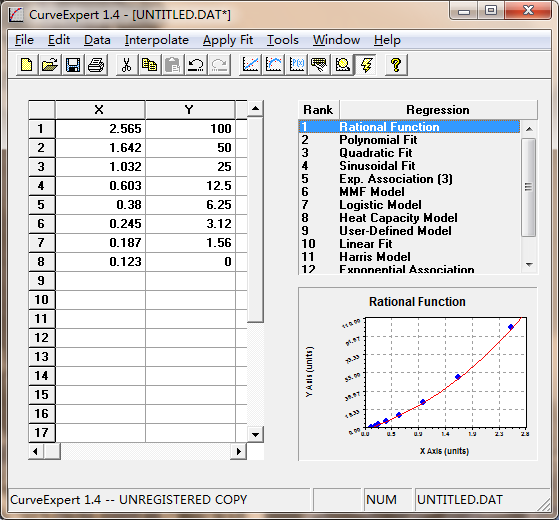
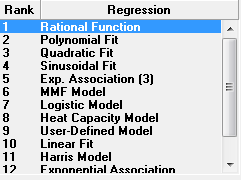
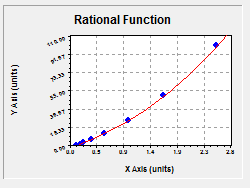
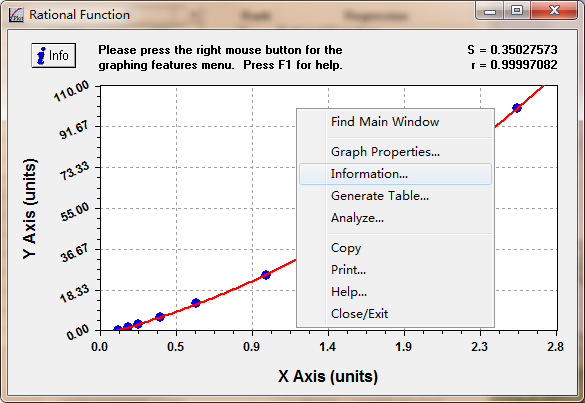
5. Find the names of the curve in the upper right corner. Click the names one by one from Rank "1", you will see the corresponding fitted curve in the lower right corner.
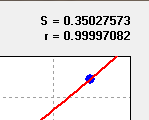
6. Select the curve with the highest fitting degree, double-click it, you will see the following dialog box.
Note: Choose the curve equation with the best coefficient("r" value).The more "r" value close to 1,the better the fitting degree is. "r" value can be found in the upper right corner
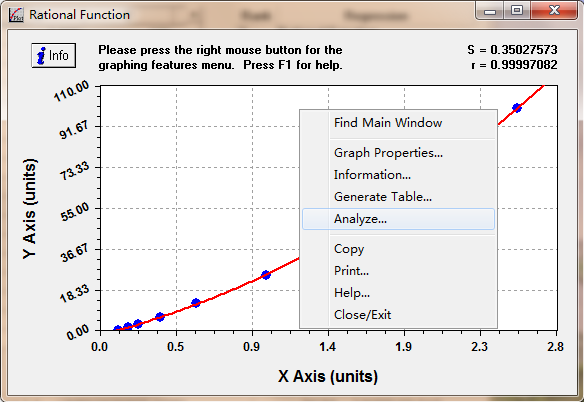
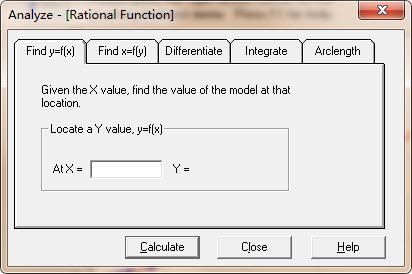
7. Press [Ctrl] key + [L] key, or right-click the dialog box and select "Analyze", the following dialog box appears :
8. Input the OD values of the standard, click

button, you will get the content of the protein(please note to multiply the number calculated by the times that the sample diluted.)
9. If you want the equation of the ELISA fitting curve, right-click the blank of the dialog box in step 6,select "information"
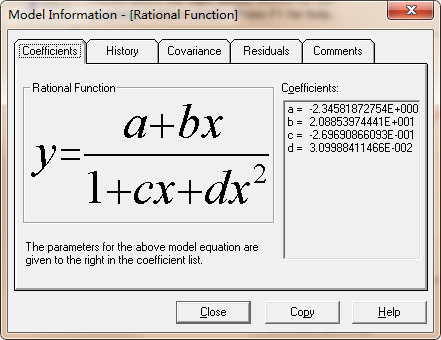
10. You will get the following dialog box
Click "Copy" and paste it where you want ,you will obtain the data below:
Rational Function: y=(a+bx)/(1+cx+dx^2)
Coefficient Data:
a = -2.34581872754E+000
b = 2.08853974441E+001
c = -2.69690866093E-001
d = 3.09988411466E-002

 Phone:
  E-mail:
  Address: